Marketing and sales teams are swimming in data, and in available tools to collect, analyze, and visualize their data.
But what's most important for marketing and sales teams is often data that's right in front of us, and right within our HubSpot portals. In order to drive growth, it's important to hone in on the most critical data that impacts your bottom line. All that's required is knowing where and how to look for this information.
Here are six key reports you can create in HubSpot to measure the impact of your marketing and sales efforts, along with step-by-step directions on how to create them.
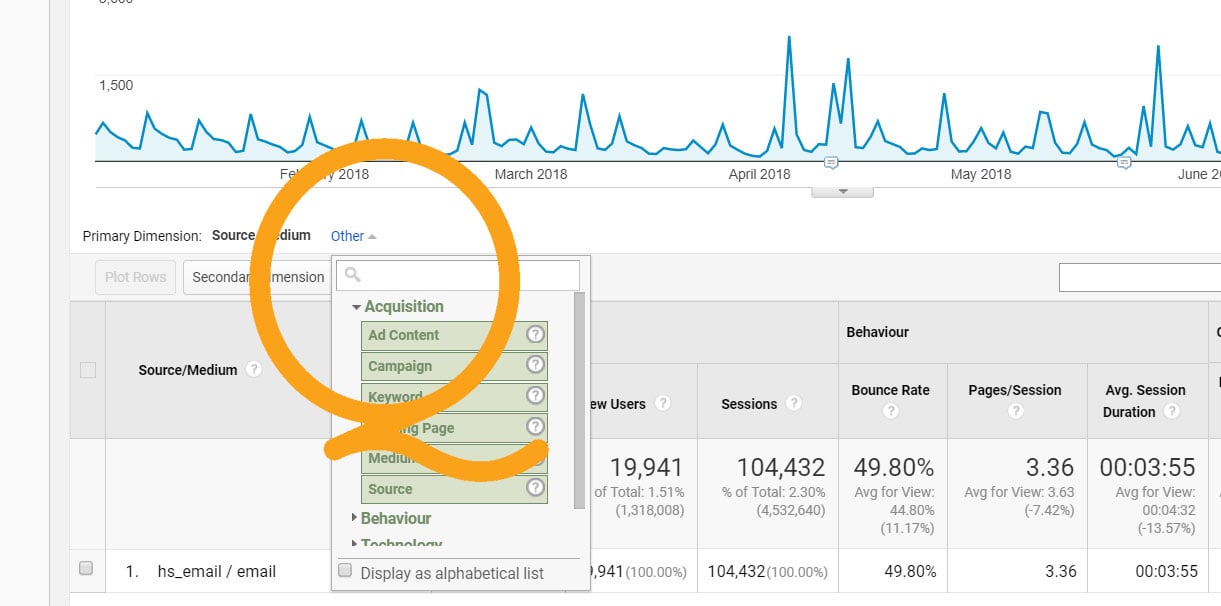
1. Conversions by Original Lead Source
The most direct way to measure your marketing efforts and ad spend is to tie each conversion and each closed deal back to its original lead source or campaign. Knowing and understanding this data is critical to planning and managing your sales and marketing functions.
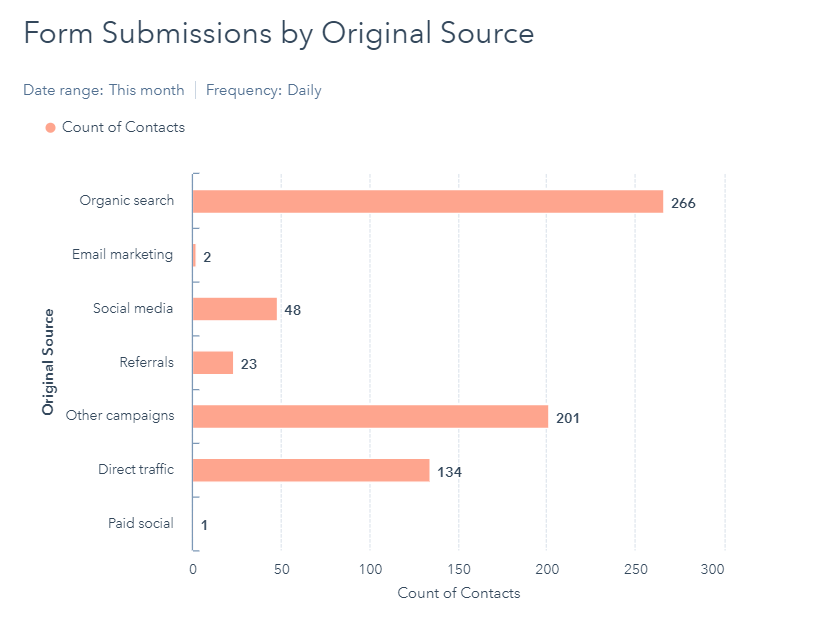
HubSpot uses a default property named "Original Source" to capture how a customer first enters your database. This makes first touch attribution reporting very easy in your HubSpot CRM.
Analyzing this data in HubSpot allows you to maximize your team's efforts and budget. For example, if you're converting a high percentage of your customers from social media channels, but not from paid paid search, maybe it's time to pause your AdWords spend and put some more resources behind a social campaign that combines a mix of boosted and targeted posts.
Make sure you take the time to understand the differences in visitor behavior among your various audiences. Take note of which personas engage on specific channels or mediums, and design content that speaks to them.
To create this report in HubSpot:
- Create a new SINGLE object CONTACT report.
- Update the filter to your desired date range (optional: select only certain forms to include in your report).
- Select the "Form Submission" and "Original Source" properties in the data step.
Bonus Tip: Segmented Reporting by Original Lead Source in HubSpot
You can build a number of different reports to segment your contacts by original lead source. Once you create the base report, consider what questions you can answer using the data breakout by original lead source such as average sale price and time to close.
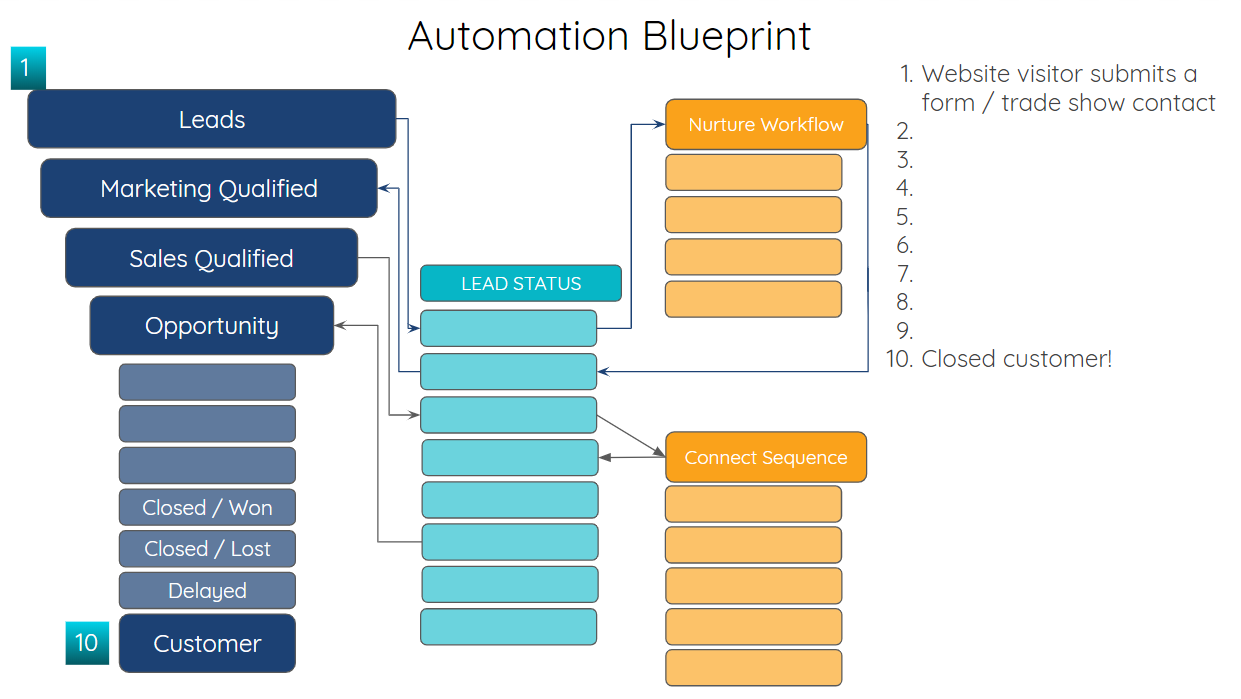
Want Better Pipeline Metrics?
Map your lifecycle stages, lead statuses, and deal pipeline using this HubSpot automation blueprint.

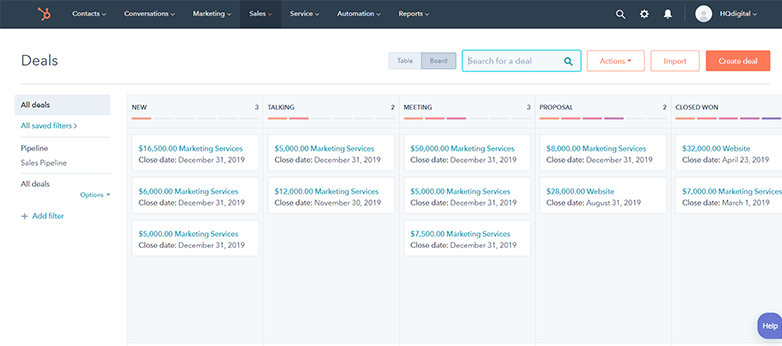
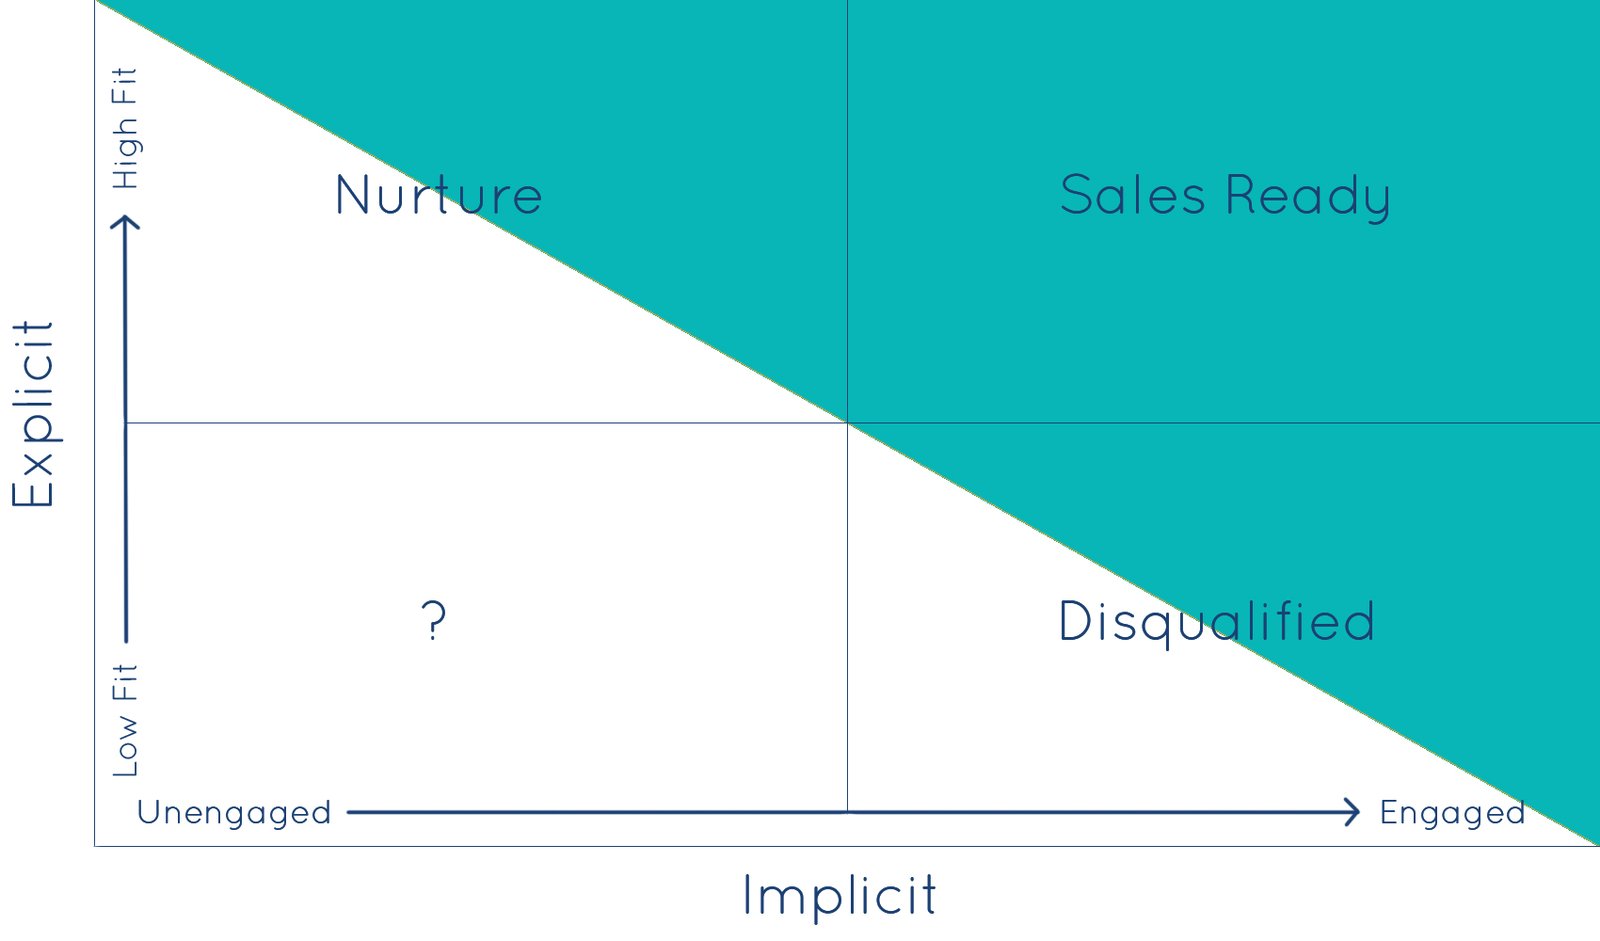
2. Conversion Rates by Lifecycle Stage
This report tracks your subscribers, leads, MQLs, SQLs, Opportunities, and Customers. These are the default HubSpot lifecycle stages, and they represent the various stages of your sales and marketing funnel.
These metrics might seem a bit rudimentary to advanced digital marketers, but it's essential to benchmark these numbers on a monthly and quarterly basis (or any custom interval). Why bother measuring traffic and conversion rates if you aren't paying attention to these metrics first?
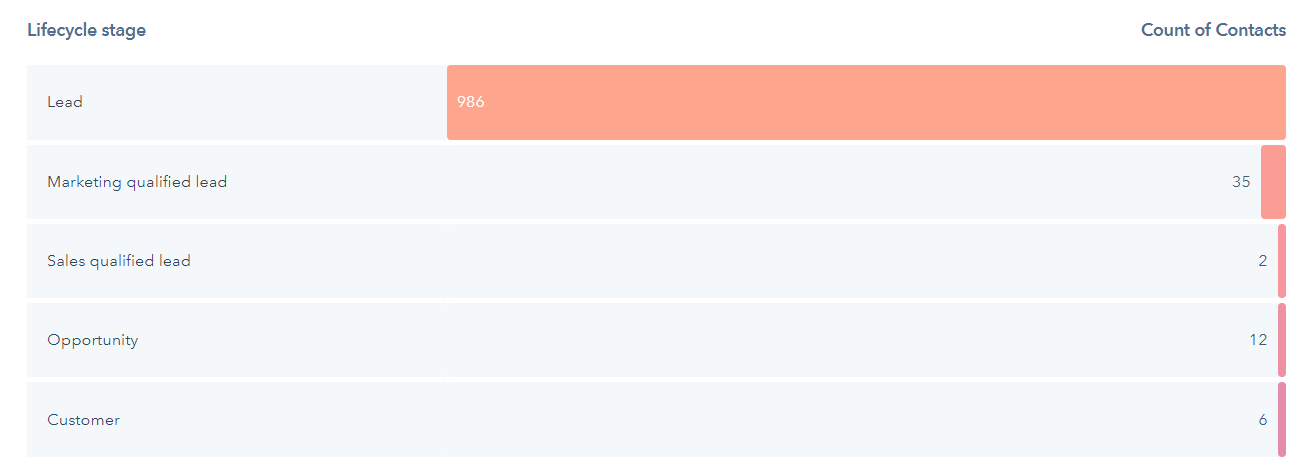
Set a goal of "X" number of customers or "Y" monthly sales attributed to your website. Setting specific lifecycle stage-based goals will help keep your entire team focused, contributing, and accountable.
You should also measure conversion rates between these different lifecycle stages. This is incredibly valuable in helping you laser-focus on areas of weakness where you can improve your overall marketing and sales functions or processes. This Reporting also provides you with the data to identify exactly how many leads you will need to hit your lead generation and revenue goals.
To create this report in HubSpot:
- Create a new FUNNEL report and select CONTACTS object.
- Add the stages you want to include in the report.
- Update the filter to your desired date range (optional: select only certain forms to include in your report).
- Configure your funnel report to show contacts that have been through ALL of the selected Lifecycle Stages or ANY of the selected Lifecycle Stages.
3. Average Sale Amount and Time to Close by Original Source
Average sale amount and average time to close are two common metrics sales teams closely monitor. Marketers need to focus on this data too, especially when there are significant variances between channels.
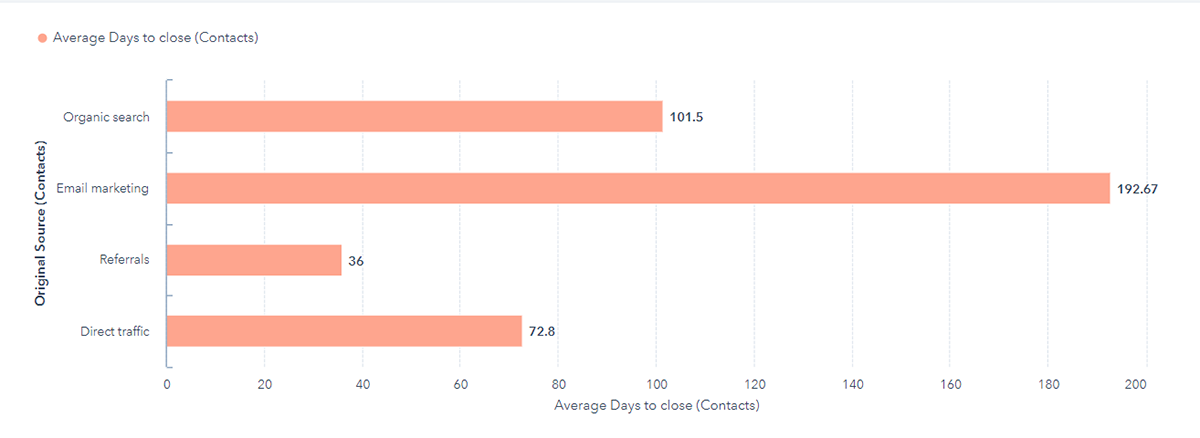
Give your marketing team access to time-to-close metrics in your HubSpot CRM. Tying sales and revenue directly into your CRM lets you measure what works on your website to drive revenue and what doesn't (same goes for ads, social media, email marketing, etc.). If you don't have this today, your marketing ROI is somewhat of a mystery. Solve this!
Even if it means taking the time to manually add deal amounts after they have closed, determine what will illuminate these numbers for you and your team.
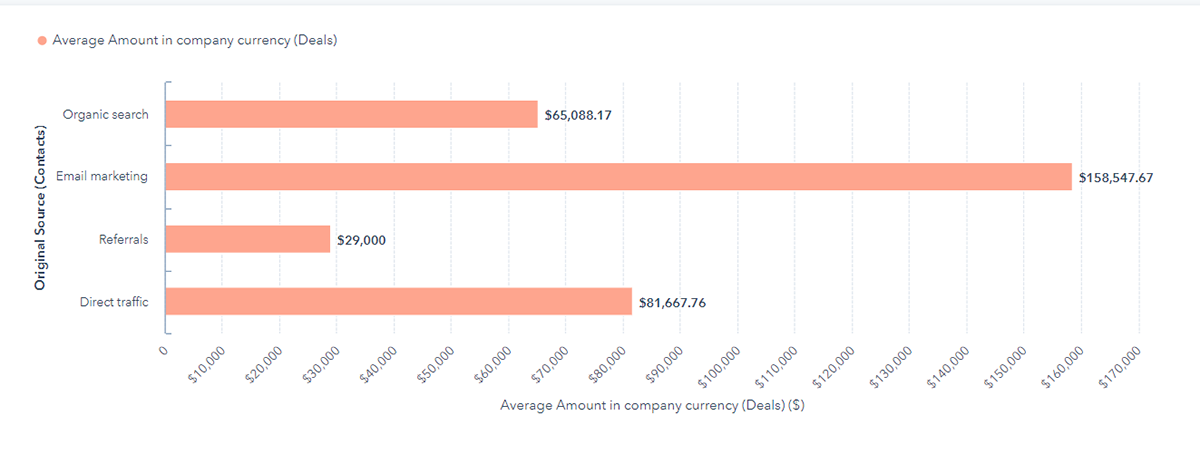
Segment your customers from the last quarter by lead source to see if there is a significant difference between the sale amounts and the time to complete a sale.
To create this report in HubSpot:
- Create a new SINGLE object CONTACT report.
- Update the filter to your desired date range (optional: select only certain forms to include in your report).
- Select the "Days to Close" and "Recent Deal Amount" properties from the data step.
- Change your "measured by" metric from "total" to "average."
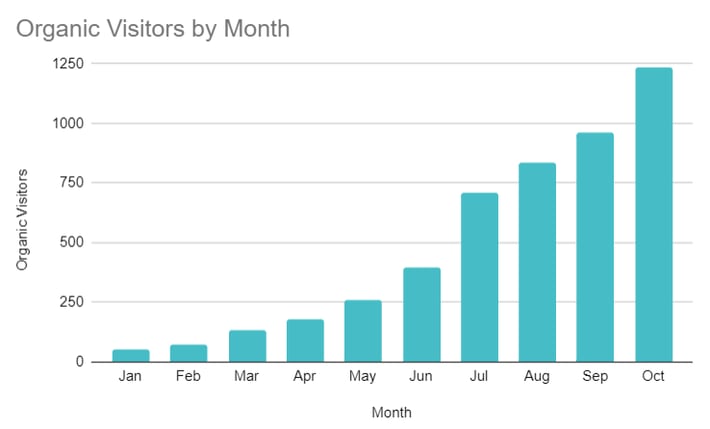
4. Month-Over-Month Organic Traffic
If you create compelling, engaging content for your audience, organic traffic has the potential to be your strongest contributor of qualified leads and a consistent source of great new business opportunities.
New HQ blog - published 36 posts between July 2018 to July 2019
Over time, by continuing to produce new content and returning to optimize past content, you'll begin to experience compounding growth. Your new blogs benefit from the established page authority and search traffic, and the old blogs benefit from new content with fresh internal "link juice."
How to Measure Month-Over-Month Organic Growth
This one is pretty straightforward. In the traffic analytics section of HubSpot, simply set your date range at the top of the page, and then filter to only show organic traffic.
SEO is a long-term tactic, so we recommend looking at a six-month view as well as a two-year view. Keep in mind that dips and peaks for seasonality are quite common in certain industries.
5. Highest Ranking Keywords
You can use HubSpot's content strategy tool to easily identify topics related to your business and your existing content, plus long-tail keywords, which are necessary to help elevate your position in search results.
Keep in mind that this is a long-term strategy. Investing in original and compelling content today, will deliver qualified leads 6-12 months from now (after the SERPs pick up your new pages and posts). This is true for all but the most well-established websites.
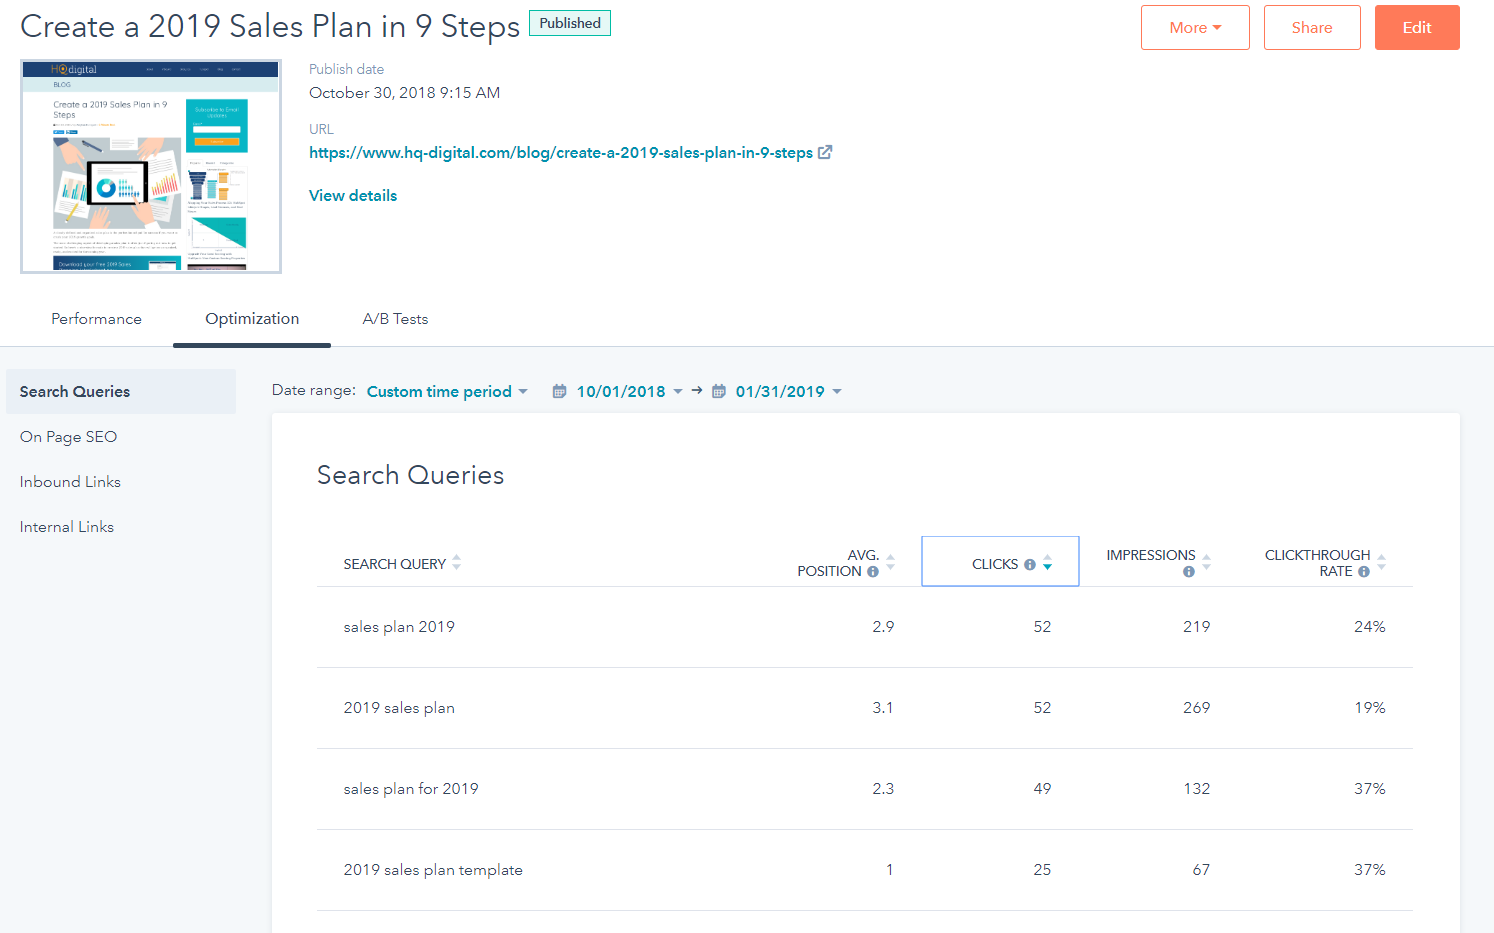
Review the keywords that provide you with the highest organic search engine ranking. Determine which words provide the best opportunities to establish domain authority. Then, based on this data, pursue a content strategy designed to bring in marketing qualified leads. Your strategy should include developing a mix of content an including gated offers to help drive lead generation / capture. But it all starts with attracting the right type of traffic!
To explore this report in HubSpot, you will need to enable the free Google Search Console integration (learn how in this blog).
- Navigate to the "Page Performance" view for one of your pages or blog posts
- Select the "Optimization" tab
- Filter by search queries, clicks, and impressions
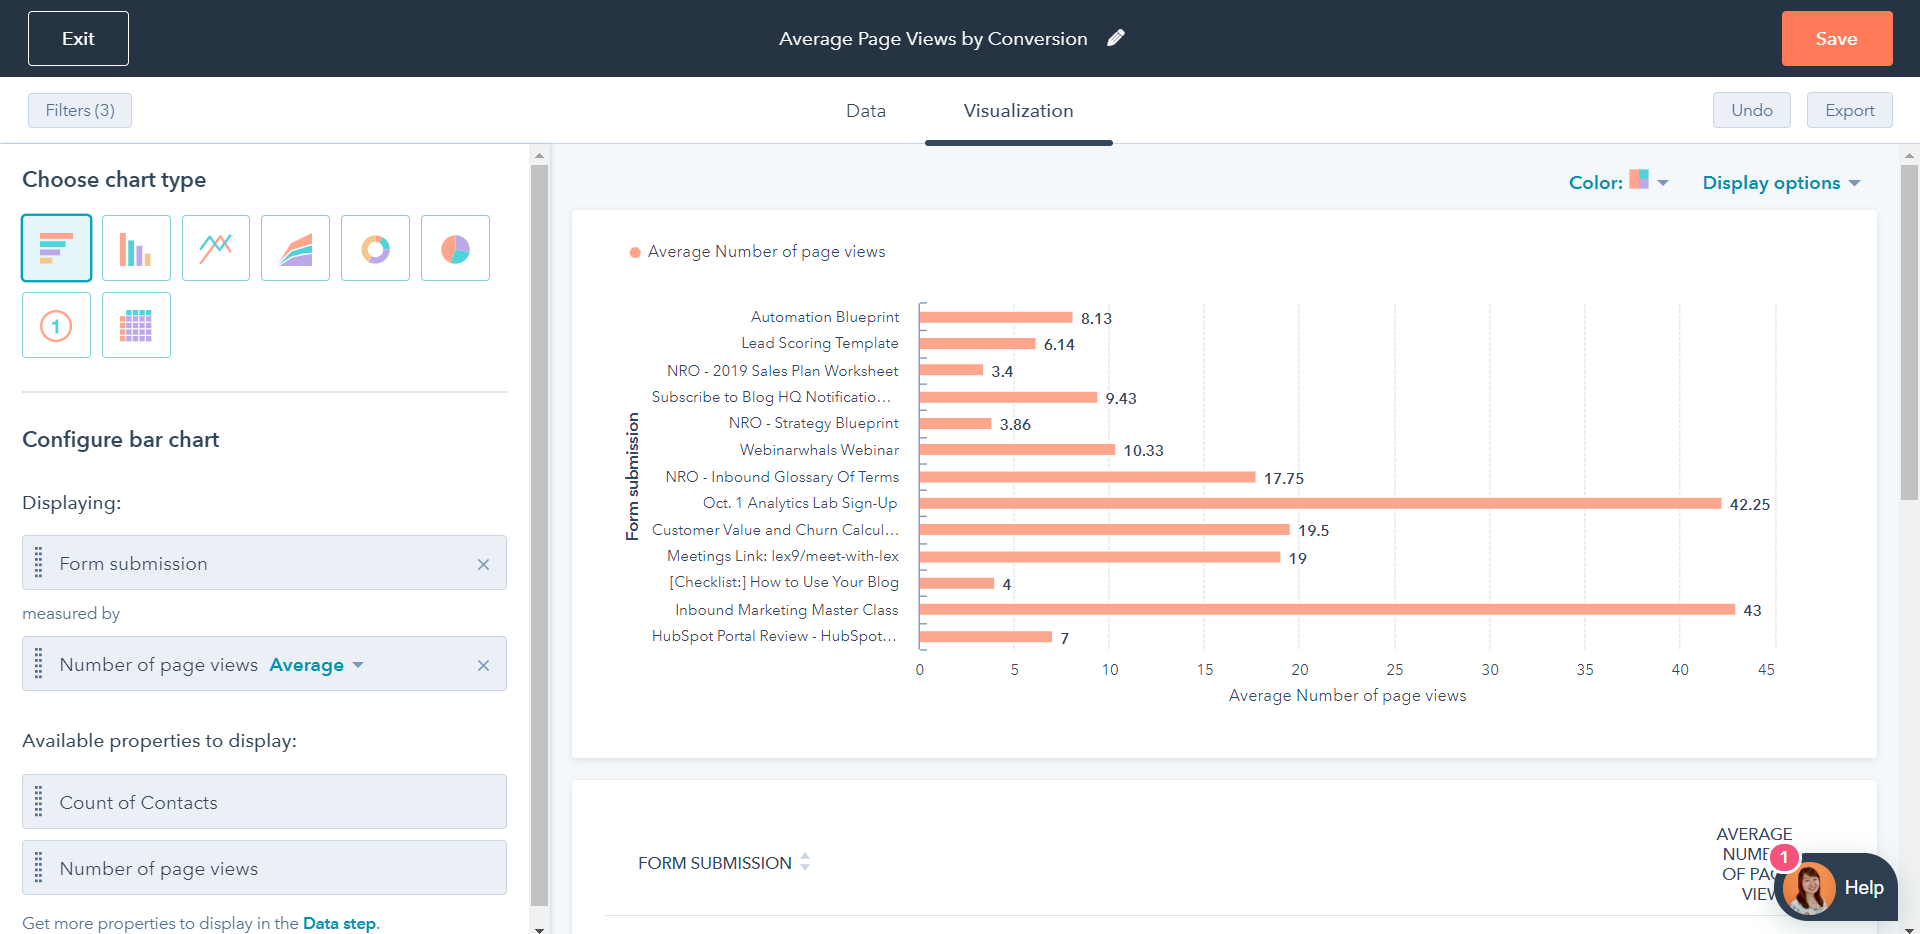
6. Average Number of Page Visits per Conversion
Your marketing and sales teams need to know how often your customers and leads are engaging with your website before they convert or move down the funnel.
For example, if you know that a new customer will visit an average of 11 pages on your website before they convert, you can start honing in on prospects that already have 6-8 page views. This group of leads is primed for nurturing with highly relevant, educational content that provides thoughtful solutions directly related to their pain points.
To measure this, we are going to assess the number of page views each customer had before they ultimately became a lead (or a customer).
A similar metric could be centered around number of email engagements or number of sales team touches before each conversion. Don't forget to include them in your lead scoring too!
To create this report in HubSpot:
- Create a new SINGLE object CONTACT report.
- Update the filter to your desired date range (optional: select only certain forms to include in your report).
- Select the "Form Submission" and "Number of Page Views" properties from the data step.
- Change your "measured by" metric from "total" to "average."
No mater your industry or experience level, it's easy for marketing and sales teams to feel overwhelmed by the data available to them. Luckily, you can leverage HubSpot reports to uncover truly illuminating insights for your organization - you just need to know where to look and how to assemble the data withing the platform. Use the guides above to create these key reports in HubSpot, and accelerate your sales and marketing funnels as a result.

Magicians With Your Metrics
Need help measuring and analyzing your marketing and sales data in HubSpot?