The time has come. 2019 will be the year of data-driven digital marketing. I can feel it. For years, marketers have had access to an increasing set of digital metrics, and 2019 is going to be the year when digital marketers finally start using their data to make smart, informed analytics decisions that impact revenue growth.
To get there, you need to begin by understanding which are the most important metrics to track as part of your digital marketing efforts. There is just so much data available to marketers, it can challenging to know where to focus your time and efforts.
Here's our list for the most important digital marketing metrics to track in 2019. Benchmark these critical metrics now to start seeing real return on your digital marketing investment in the year ahead.
Top-Trafficked Pages, Content, and Blogs
It's important to have a good handle on what pages of your site, whether they are services pages, landing pages, or blog posts, are garnering the most views, sessions, or users per month. Knowing these numbers allows you to prioritize optimization initiatives, because changes you make on your most highly-trafficked pages will be most impactful.
Use these numbers as signals from your target audience as to what type of content they prefer to consume on your website. Look for patterns, like a certain media type, like an infographic or webinar, that tend to get more or less attention than other types of content. Similarly, look for performance outliers in your blog content in order to determine what topics are interesting to your audience and which are not as appealing. Use these insights to replicate success and minimize failure in your next campaign.
Website Conversion Rate
Your website conversion rate is the percentage of users who convert (complete a form) on your website out of the total number of users that come to your site. The average website converts at between 1-3%, but this number varies depending on many factors, including industry, size of your website, target audience, structure of your website, and more.
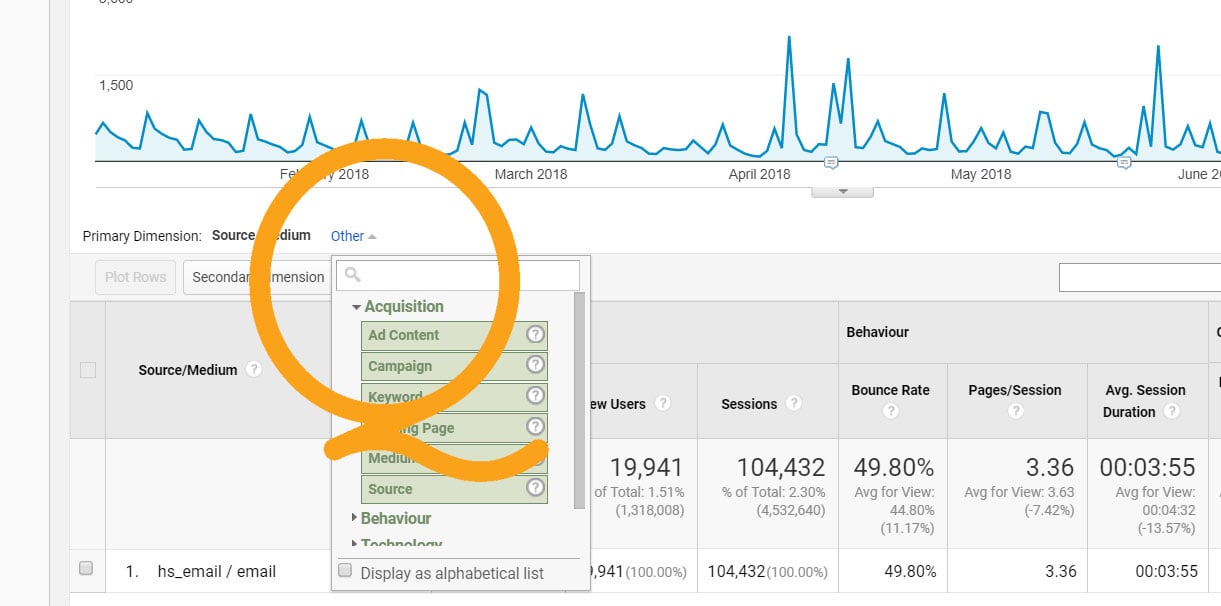
Conversion Rates by Source
Knowing your conversion rates by traffic source allows you to optimize specifically to improve performance on a particular channel, and it lets you know where to focus your efforts.
For example, if you're spending a ton of time managing your social media, but your conversion rate across your social channels is very low, you will have insight to make a decision to either spend less time on social media, or start focusing on improving that number.
- Organic traffic means visits to your website that originate from a keyword research in a major search engine. Organic visitors find your website listed in the SERPs and click through to get the information that they need. Organic traffic includes traffic for all searches, including both branded and non-branded keywords. You can improve organic traffic and conversion rate by focusing on SEO for your website pages and marketing content.
- Referral traffic means website visits that originate from a user clicking through from a different website. Referral traffic includes visits from business directories, guest blogs, press releases, and more. Take note of your top referral sources to gain even deeper insight into this metric.
- Direct traffic means users who get to your website by typing your URL directly into their browser bar.
- Paid traffic is website traffic that you pay for, through a paid advertising campaign, either on Google AdWords, Bing Ads or through social media advertising. Some companies track social media advertising as a separate channel called "paid social."
- Social traffic is website traffic that originates on a social media platform, like Facebook, YouTube, LinkedIn, Twitter, or Pinterest. It is usually helpful to break down this conversion rate again, into the specific networks, as they exist for different reasons and likely have unique metrics. Evaluating conversion rates by individual network can be really helpful to identify where your marketing team should be spending its time.
When working on a conversion rate optimization (CRO) initiative, consider the complete user path from each traffic source. What does it feel like to your user - what is their user experience like, for example, when they come to your website from LinkedIn? For most companies, these visits result from sharing marketing content. These users are generally looking for educational information the topic that they clicked on, and they may not be familiar with your brand at all. Adding validation elements, like logos of prominent clients or client testimonials, can help boost conversion rates for social visitors.
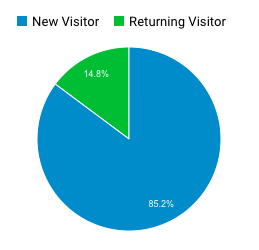
New vs. Returning Visitors
Understanding how many unique visitors are coming to your website each month gives you insight into the stickiness of your content. If users think your content is good, they'll come back for more. It's important to focus on bringing both new and returning visitors to your website.
Alone, this metric may not seem particularly useful; however, when you break it down further, this information provides valuable insights into your audience's loyalty to your brand.
To increase new users to your site, work on website traffic drivers, like SEO, new website pages, and blogging. To start seeing a higher percentage of returning visitors, identify where users are coming from and what they're looking for, then make sure that your site provides them with it. Update your site regularly to entice return visitors as well.
Schedule a free marketing assessment to get customized strategy recommendations for your business.


Time-on-Site
Time-on-site is a metric that indicates how engaged a user is with your site, by measuring the time your users spend browsing your website after they land. If they spend no time, it's considered a bounce. Most companies see an average time-on-site of about 2-3 minutes.
Time-on-site is a nice all-purpose barometer of how well your site is performing overall. The reason for this is because users who spend a lot of time on your site are finding valuable and useful content.
Additionally, users who spend a lot of time on your website are most likely to be your most engaged leads and are more likely to become customers.
Pages-per-Session
Pages per session means the number of distinct pages a user viewed once they hit your site. This metric, combined with time-on-site, gives marketing teams a clear window into how engaged website users are with your brand.
When you review this metric in combination with top entry or exit pages, areas to optimize for improved engagement with your site become apparent.
Email Open Rate
 In 2019, expect increased emphasis on email marketing metrics, like open rate and clickthrough rate. Increasing data privacy laws combined with the continued flood of emails into users inboxes will mean the fight for a user's attention will be even more fierce.
Your email open rate should be at least 20% across the board for your digital marketing emails. If your company has a low email open rate, the good news is that there are only a few possible areas that might need tweaking.
- Email subject line - probably the most important factor in a reader's decision to open. Make sure your subject line is descriptive and personalized, and be sure not to include any words that might trigger a spam filter.
- Email from name - for higher open rates, send your marketing emails from the name of a real person at your company, over a generic company name showing up in your readers' inboxes.
- Email from address - similar to the above point, avoid sending your marketing emails from a generic email address like info@yourcompany.com or sales@yourcompany.com. Instead, use an actual person's email or create a variant of a person's email that can be designated for marketing emails.
Email Clickthrough Rate
Your email clickthrough rate is the percentage of those people who opened your email that clicked through to your website or blog. These clicks can be on links or CTAs, though a best practice is to present only one option per email whenever you can help it.
Email clickthrough rates give you an idea of how appealing your offer was to your audience and how well your offer aligns with your subject line. After all, if you used a descriptive subject line, your reader should already know what to expect when they click on the email. Deliver on that promise and prompt a logical next step, and you're likely to see your clickthrough rates increase.
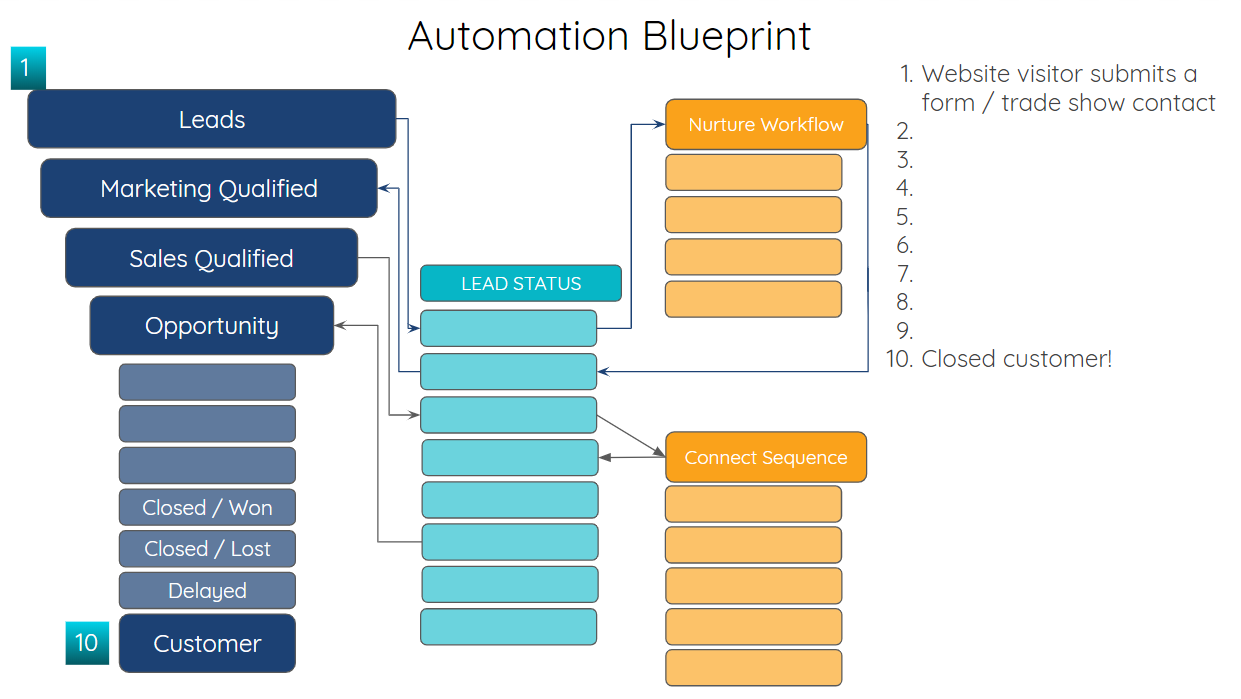
Lead-to-Customer Ratio
Your lead-to-customer ratio means the percentage of leads who ultimately become customers or clients. This is an extremely useful indicator of the success of your digital marketing program and one that directly connects marketing with your bottom line.
Many marketing and sales organization usually break this metric down even further, identifying various stages of leads, such as Marketing Qualified Lead (MQL), Sales Qualified Lead (SQL), or Sales Opportunity. Understanding the conversion rates for each stage of your sales funnel will give you visibility where to focus your efforts to get the most impactful results quickly.
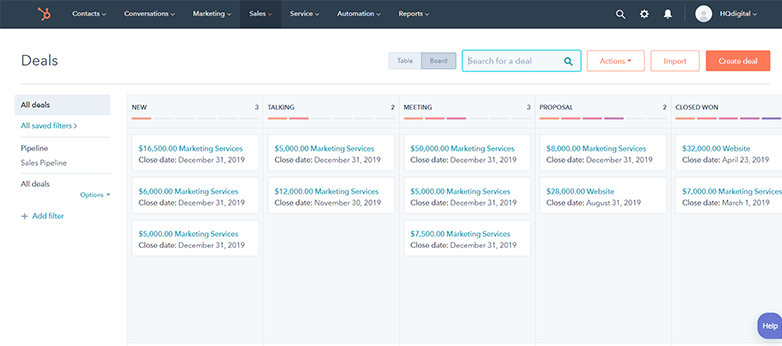
Average Sales Cycle
It's important to have a good grasp on your average sales cycle as your marketing and sales teams gear up for 2019. Use this metric to inform your marketing and identify opportunities for sales enablement content. Here are a few ways marketing can help shorten your average sales cycle:
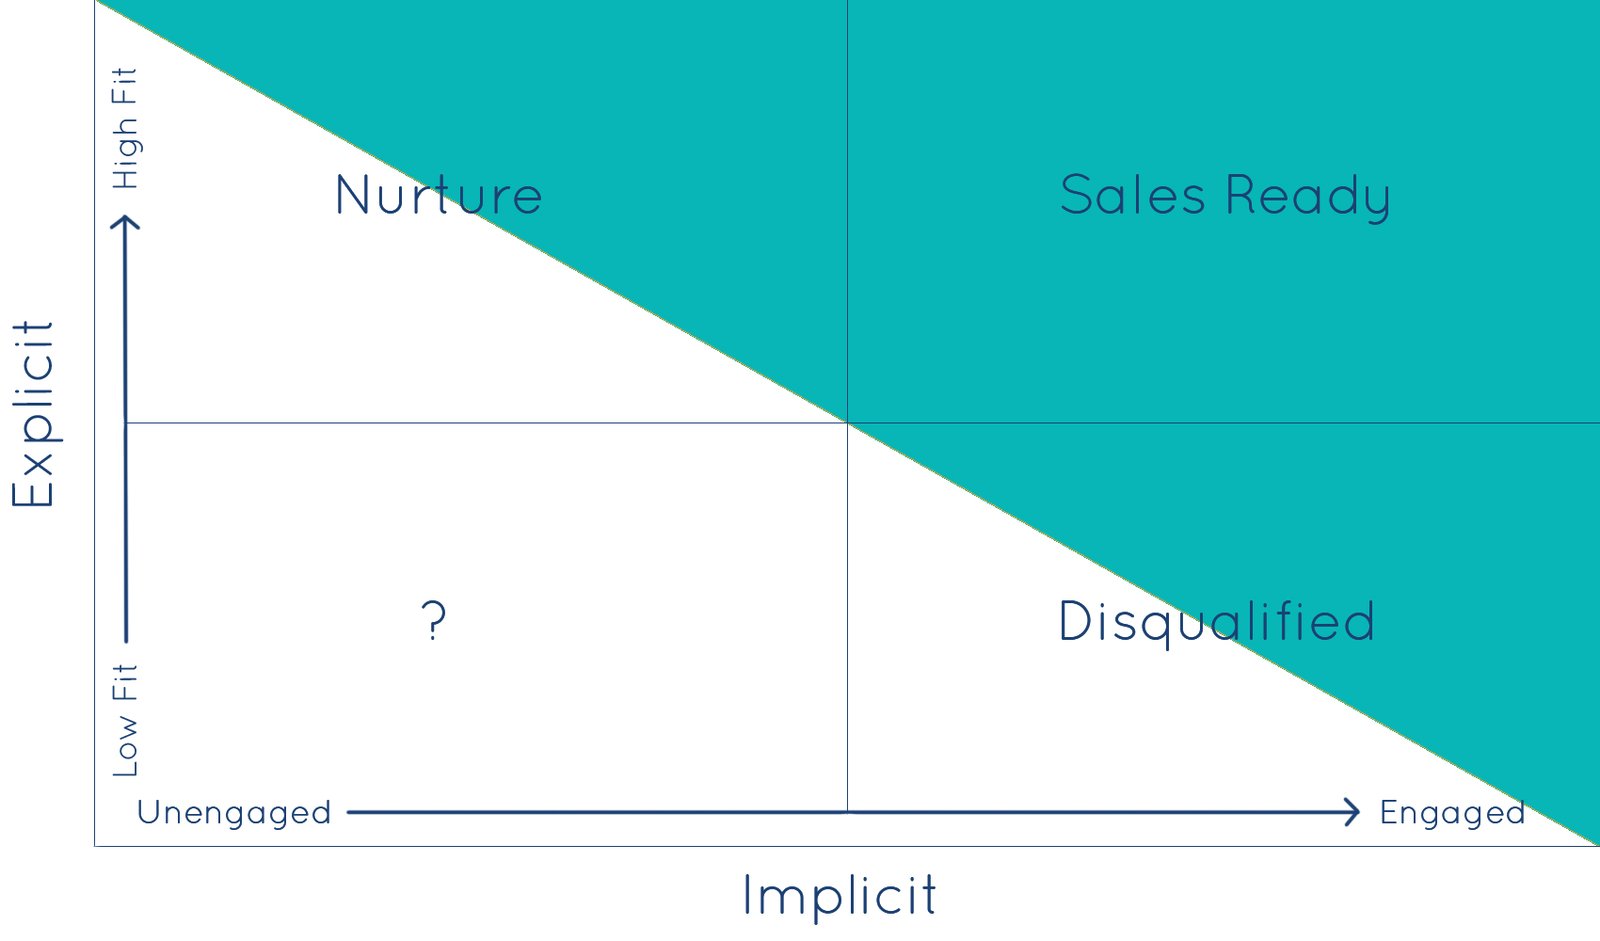
- Lead nurturing campaigns that create warmer, more engaged leads
- Lead scoring models that identify and automatically hand off your most engaged leads to sales
- Sales enablement content, like case studies, decision guides, or pricing sheets to support your sales team all the way through to close
Cost-per-Lead (CPL)
Cost-per-lead (CPL) means the total amount of money it takes on average to generate a new lead. This is a vital metric to understand and optimize for if you're serious about revenue generation attributable from marketing.
To calculate CPL, take your total marketing spend (per quarter, per month, or annually, depending on how you want to track), and divide it by the number of leads generated during that same time period.
This is a tricky metric to calculate when you start factoring in things like salaries, your website, and properly tracking attribution for your digital marketing leads. When working on this metric, start small, using a fresh campaign, and optimize your approach as you move forward.
2019 will be a huge year for companies willing to invest in measuring and improving key digital marketing metrics. Start tracking the above digital marketing metrics today to set yourself up for your best year ever.
Schedule a free marketing assessment to get customized strategy recommendations for your business.